
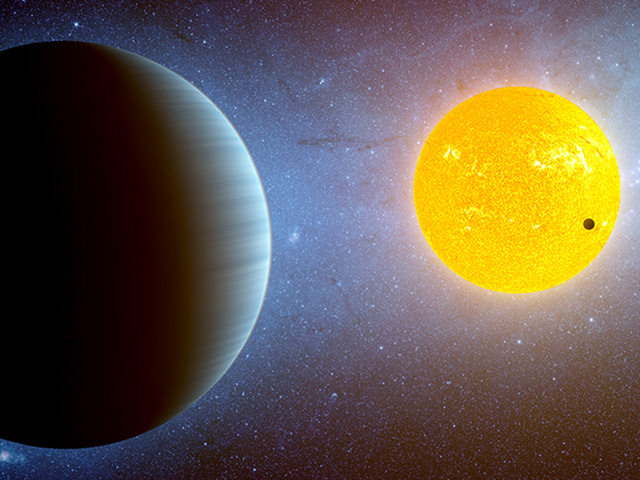
There’s an intriguing exoplanet out there – 400 light-years out there – that is so tantalizing that astronomers have been studying it since its discovery in 2009. A year for WASP-18 b, one orbit around its star (slightly larger than our Sun), takes just 23 hours. There’s nothing like it in our solar system. In addition to observatories on the ground, NASA’s Hubble, Chandra, TESS, and Spitzer space telescopes have all observed WASP-18 b, an ultra-hot gas giant 10 times more massive than Jupiter. Now astronomers have taken a look with NASA’s James Webb Space Telescope and the ‘‘firsts’’ keep coming.
The discovery: Scientists identified water vapor in the atmosphere of WASP-18 b, and made a temperature map of the planet as it slipped behind, and reappeared from, its star. This event is known as a secondary eclipse. Scientists can read the combined light from star and planet, then refine the measurements from just the star as the planet moves behind it.
The same side, known as the dayside, of WASP-18 b always faces the star, just as the same side of the Moon always faces Earth. The temperature, or brightness, map shows a huge change in temperature – up to 1,000 degrees – from the hottest point facing the star to the terminator, where day and night sides of the tidally-locked planet meet in permanent twilight.
‘‘JWST is giving us the sensitivity to make much more detailed maps of hot giant planets like WASP-18 b than ever before. This is the first time a planet has been mapped with JWST, and it’s really exciting to see that some of what our models predicted, such as a sharp drop in temperature away from the point on the planet directly facing the star, is actually seen in the data!’’ said Megan Mansfield, a Sagan Fellow at the University of Arizona, and one of the authors of the paper describing the results.
The team mapped temperature gradients across the day side of the planet. Given how much cooler the planet is at the terminator, there is likely something hindering winds from efficiently redistributing heat to the night side. But what is affecting the winds is still a mystery.
‘‘The brightness map of WASP-18 b shows a lack of east-west winds that is best matched by models with atmospheric drag. One possible explanation is that this planet has a strong magnetic field, which would be an exciting discovery!’’ said co-author Ryan Challener, of the University of Michigan.
The latest

One interpretation of the eclipse map is that magnetic effects force the winds to blow from the planet’s equator up over the North pole and down over the South pole, instead of East-West, as we would otherwise expect.
Researchers recorded temperature changes at different elevations of the gas giant planet’s layers of atmosphere. They saw temperatures increase with elevation, varying by hundreds of degrees.
The spectrum of the planet’s atmosphere clearly shows multiple small but precisely measured water features, present despite the extreme temperatures of almost 5,000 degrees Fahrenheit (2,700 C). It’s so hot that it would tear most water molecules apart, so still seeing its presence speaks to Webb’s extraordinary sensitivity to detect remaining water. The amounts recorded in WASP-18 b’s atmosphere indicate water vapor is present at various elevations.

‘‘It was a great feeling to look at WASP-18 b’s JWST spectrum for the first time and see the subtle but precisely measured signature of water,’’ said Louis-Philippe Coulombe, a graduate student at the University of Montreal and lead author of the WASP-18 b paper. ‘‘Using such measurements, we will be able to detect such molecules for a wide range of planets in the years to come!’’
Researchers looked at WASP-18 b for about six hours with one of Webb’s instruments, the Near-Infrared Imager and Slitless Spectrograph (NIRISS), contributed by the Canadian Space Agency.
‘‘Because the water features in this spectrum are so subtle, they were difficult to identify in previous observations. That made it really exciting to finally see water features with these JWST observations,’’ said Anjali Piette, a postdoctoral fellow at the Carnegie Institution for Science and one of the authors of the new research.
The discoverers: More than 100 scientists around the globe are working on early science from Webb through the Transiting Exoplanet Community Early Release Science Program led by Natalie Batalha, an astronomer at the University of California, Santa Cruz, who helped coordinate the new research. Much of this groundbreaking work is being done by early career scientists like Coulombe, Challener, Piette, and Mansfield.
Proximity, both to its star and to us, helped make WASP-18 b such an intriguing target for scientists, as did its large mass. WASP-18 b is one of the most massive worlds whose atmospheres we can investigate. We want to know how such planets form and come to be where they are. This, too, has some early answers from Webb.
‘‘By analyzing WASP-18b’s spectrum, we not only learn about the various molecules that can be found in its atmosphere but also about the way it formed. We find from our observations that WASP-18 b’s composition is very similar to that of its star, meaning it most likely formed from the leftover gas that was present just after the star was born,’’ Coulombe said. ‘‘Those results are very valuable to get a clear picture of how strange planets like WASP-18 b, which have no counterpart in our solar system, come to exist.’’


